Coffee Sales Dataset
This project delves into three datasets containing information about orders, customers, and products belonging to a coffee retail company. By examining all the provided data, the purpose is to uncover hidden patterns and gain actionable insights into sales and purchasing behavior aspects.
The Coffee Sales project will be exclusively conducted using Excel, focusing on effectively cleaning and structuring the orders dataset to ensure clarity and coherence. Subsequently, the results will be presented through a dashboard created within Excel to showcase the findings.
Take a closer look at the raw orders dataset (Excel)

EXCEL DATA ANALYSIS
During the initial phase, the orders table is populated by merging data from the customers and products tables. This integration relies on the utilization of XLOOKUP and IF functions to retrieve the necessary information. Additionally, a simple calculation is made to generate values for the sales column, while standardizing date formats, number types, adding columns, renaming data, and addressing any duplicate entries. Following these steps, the dataset is structured into a table for further analysis and visualization.
The dataset post-column modifications.

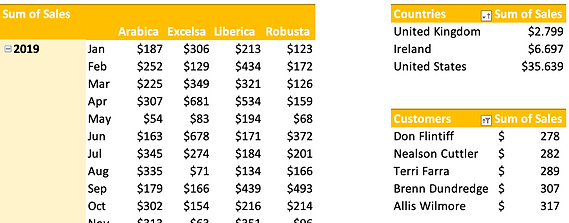
In the second phase, pivot tables are created from the orders table to analyze sales figures on a yearly and monthly basis, segmented by country and customers. These pivot tables are given a color, are also sorted to ensure coherence, and are prepared to populate a comprehensive dashboard containing all the relevant insights and data points.
In the third phase, the charts are crafted for each pivot table with an integrated timeline to facilitate the selection of time intervals for visualization based on date parameters. Additionally, three slicers representing coffee types are incorporated into the dashboard. The whole dashboard adopts a yellowish tone for consistency and aesthetic appeal. Furthermore, all the visualizations are dynamically linked with the timeline and slicers for better interaction, thereby enabling easier exploration of insights within the dataset.
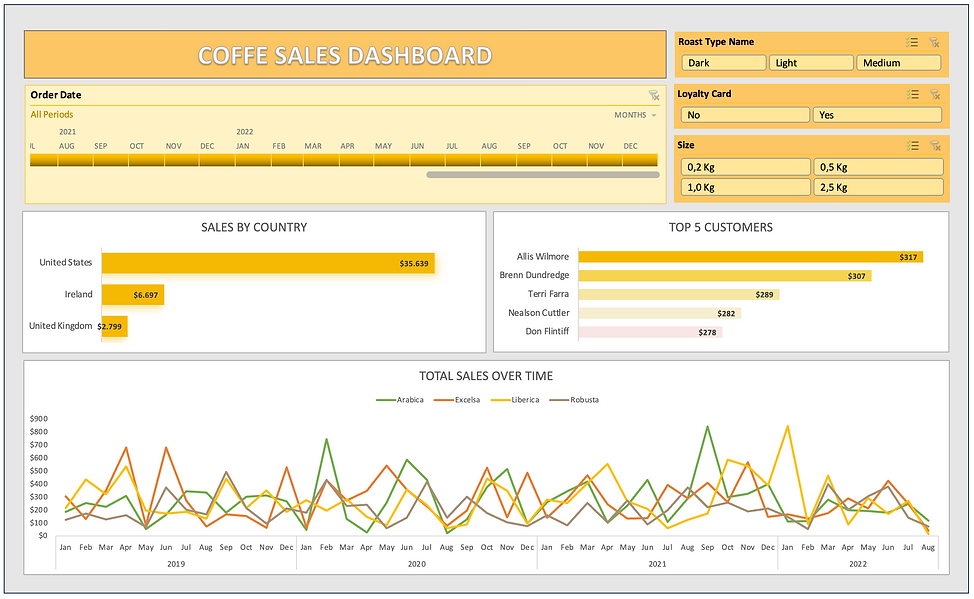
GENERAL FINDINGS
1. Between 2019 and 2022, the country distribution shows that the United States registered the highest sales figures. Conversely, sales of coffee in the United Kingdom remained notably lower. This trend shows a clear difference in coffee consumption between these two countries, possibly influenced by various factors such as cultural preferences, customer behavior, and others.
2. Between 2019 and 2022, there is a notable customer purchasing behavior, with Allies Wilmore emerging as the customer that buys the most coffee, closely followed by Brenn Drundredge. This ranking highlights the loyalty of these individuals towards the coffee products offered and their significant contribution to the overall sales performance during this timeframe.
3. Between 2019 and 2022, there were notable peak sales recorded, especially for the coffee variant known as Liberica, reaching a remarkable value of $844 in January 2022 representing the highest monthly sales in the entire timeframe. It was followed by another high peak in September 2021 where the Arabica variant fetched $841 in sales revenue. These sales were potentially influenced by factors such as seasonal trends, promotional activities, or product innovations.