Human Resources Dataset
This project seeks to analyze and explore the Human Resources data of a random company to extract meaningful insights utilizing diverse attributes such as race, gender, age distributions among employees, and so on. It aims to unravel patterns and trends in how the organization is faring.
This project will be conducted on MySQL Server to demonstrate my abilities in SQL queries by effectively utilizing them for data refinement by cleaning and structuring the dataset to ensure clarity and coherence. Subsequently, the results will be presented in two Power BI pages to bring the findings to life.
KEY QUESTIONS
1. What is the gender distribution of the company's employees?
2. What is the racial/ethnic breakdown of the company's employees?
3. What is the age distribution of the company's employees?
4. How many employees work at headquarters compared to remote locations?
5. What is the average length of employment for employees who have been terminated?
6. How does the gender distribution vary across departments?
7. What is the distribution of job titles across the company?
8. Which department has the highest turnover rate?
9. What is the distribution of employees across locations by city and state?
10. How has the company's employee count changed over time based on hire and term dates?
11. What is the tenure distribution for each department?
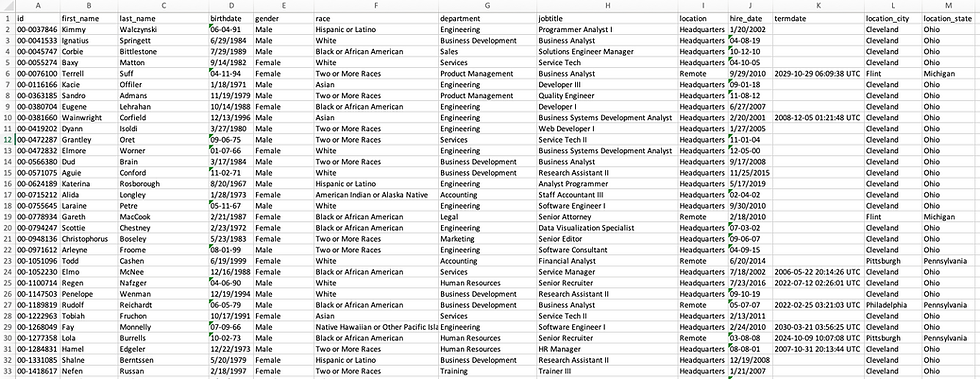
Take a closer look to the dataset (Excel) :
SQL Queries
In the initial phase, the schema is created, and the data is imported from my device into MySQL Server using the line of code LOAD DATA LOCAL INFILE, enabling the swift importation of large data within seconds.
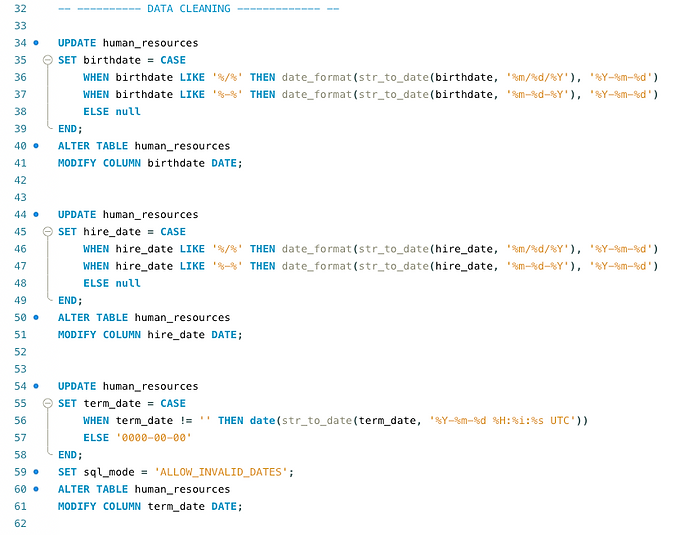
Given that certain dates are not in the correct format and contain invalid characters, it is imperative to rectify this for three columns: birth date, hire date, and termination date. Also, an age column is added to the table, calculated using the birth date and the current date for each employee.
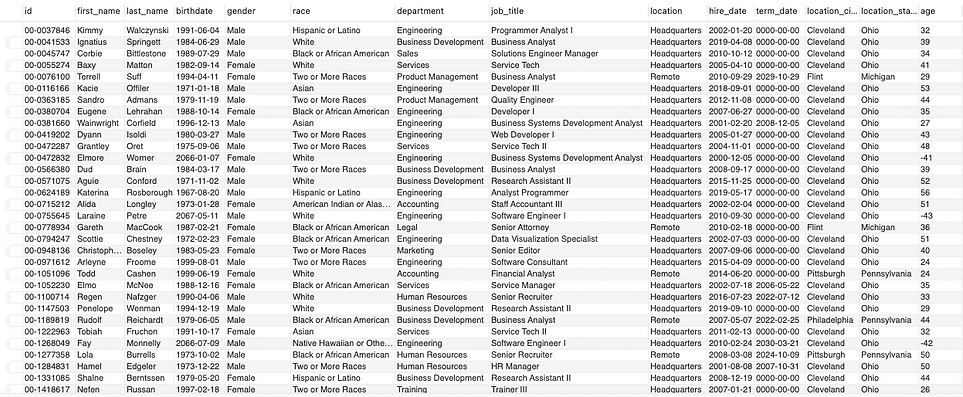
Records with negative ages and termination dates far into the future were excluded from the analysis. Only ages 18 and above were considered, along with the termination dates less than or equal to the current date.


The dataset post-column modifications (MySQL).
In the second phase, key questions will be addressed to gain insights into the distribution of age and gender, racial demographics, average length of employment, and more. This phase will involve employing SQL statements such as SELECT, GROUP BY, ORDER BY, CASE, COUNT, WHERE subqueries, and others. Once again, only individuals aged 18 and above will be considered for these queries.


In the third phase, each SQL result was downloaded as a CSV file and imported into Power BI to visualize the results effectively and add depth to the insights. This method makes it easier to identify trends and glean answers to the key questions. The Power BI report included two pages and contained all the pertinent information related to the key inquiries.
Page 1
Page 2
FINDINGS
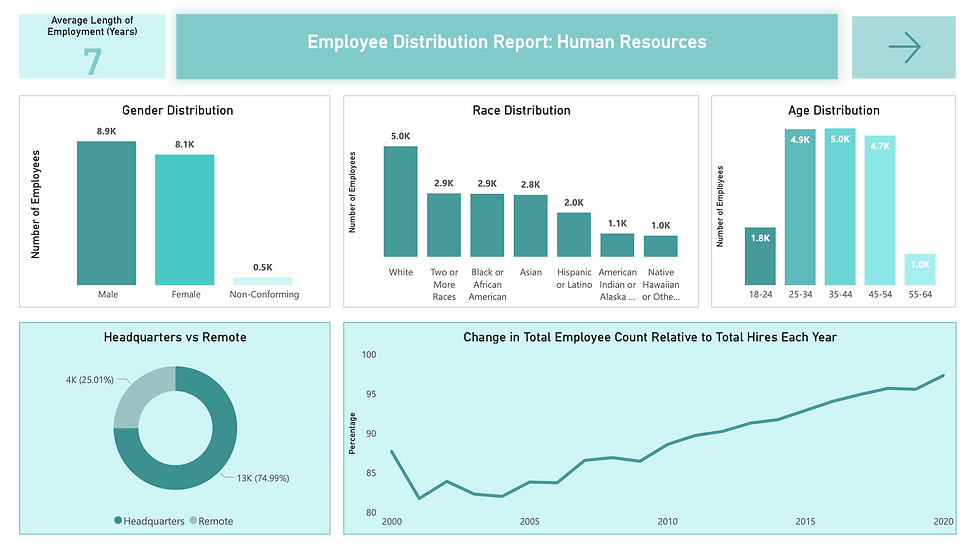
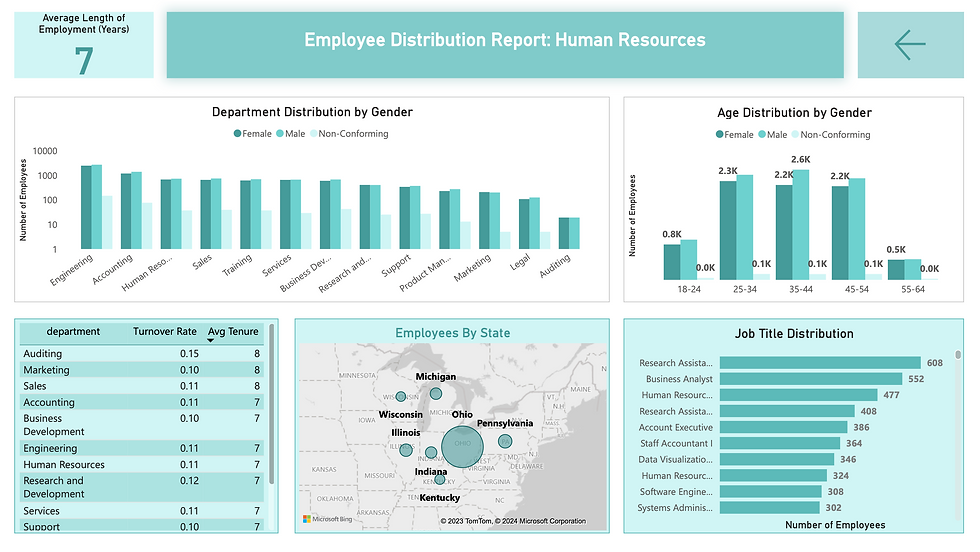
1. Gender Distribution: The data reveals a higher presence of male employees compared to female employees within the company. This suggests a gender imbalance in the workforce composition.

3. Age Distribution: The age distribution of employees shows a notable portion falling within the age range of 35 and 44, followed closely by employees aged between 25 and 34. Conversely, there is a smaller distribution of employees aged 55 - 64 and 18 - 24. The age distribution helps in customizing recruitment strategies and designing targeted training programs that can adapt to various age demographics.

5. Average Length of employment: The calculated average length of employment among employees is 7 years. This metric provides insights into employee retention rates and organizational stability.

7. Job Title Distribution: A notable proportion of the company's workforce holds the position of Research Assistant ll. Indicating a prevalent role within the organization, followed by Business Assistance.

9. A significant number of employees are originally from Ohio. This could suggest a recruitment focus on this region or a historical connection to the company's headquarters on operations in Ohio.

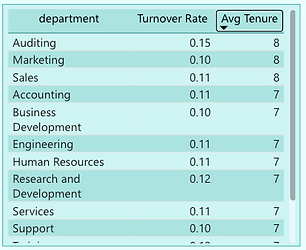
11. The average tenure for employees within each department is approximately 8 years. This indicates a considerable level of loyalty and commitment among employees. Departments such as Auditing, Marketing, and Sales demonstrate the highest average tenures. Conversely, departments such as Legal and Product management show lower average tenures.
2. Ethnic Demographics: The analysis of ethnic distribution indicates that the majority of employees are white. Conversely, American Indians and Native Hawaiians represent the smallest ethnic groups within the company. This inequality highlights potential areas for diversity and inclusion initiatives.

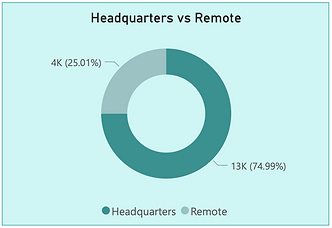
4. Work Location: There is a noticeable difference between employees working at the Headquarters and those working remotely, with a larger number of individuals working in Headquarters. This finding may have implications for workplace flexibility policies and resource allocation for remote work infrastructure.
6. Gender Distribution by Department: While gender distribution across departments appears to be fairly balanced, there is a general trend of slightly more male employees overall. However, within each department, there is a relatively equal representation of male and female employees.

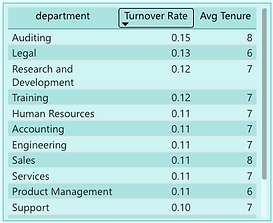
8. Turnover Rate: The Auditing and Legal departments show the highest turnover rate. Which suggests that there may be challenges in retaining employees within this department. Conversely, the Marketing and Business Development Departments demonstrate lower turnover rates, indicating higher levels of employee satisfaction and retention strategies within these departments.
10. In recent years there has been a more significant change in the number of employees relative to the total number of hires. This suggests that the company has experienced substantial changes in its workforce composition, due to rapid growth, restructuring, and others.
