Product Orders with POWER BI
The Product Orders project involves leveraging Power BI to answer various business questions by cleaning, transforming, and analyzing data, and creating a comprehensive report from a dataset that pertains to TechnoSales, a fictitious company. The dashboard provides insights into key metrics such as top and bottom 5 products by sales, sales by region, number of sales and orders per month, as well as identifying the most and least ordered products.
By visualizing this data effectively, decision-makers can gain valuable insights into sales performance, product popularity, and overall business trends, enabling them to make informed decisions to optimize operations and drive growth.
BUSINESS QUESTIONS
1. What are the top and bottom 5 performing products based on sales?
2. How do sales vary across different regions?
3. Can you provide all details about the products ordered in a given order?
4. How does the number of orders vary by time of day?
5. What is the distribution of orders by date?
6. How are sales distributed by month?
7. How many orders are received each month?
8. Which products rank in the top and bottom 5 based on cost?
9. What are the five most and least ordered products?
10. How do sales vary by product and month?
Take a closer look at the raw data (January sales - 1.017 rows)

First, the four tables containing sales data for January, February, March, and April are imported into Power BI desktop. Within the Power Query Editor, the column quality is checked. It is noted that only 1% of the values for each column are empty, which are identified and eliminated by selecting the "remove empty" option.
Additionally, it is observed that there are errors in the data due to formatting issues. To address this, the data type is temporarily changed to text to identify the information for each column. It is determined that the text fields are irrelevant to the analysis. Therefore, the "remove errors" option is utilized to eliminate these irrelevant rows, ensuring that all remaining data is formatted correctly make sure all the data format is correct.
As a result of these adjustments, the quality column now indicates "valid 100%", signifying that the data is clean and suitable for analysis, the column distribution and column profile are also checked to verify the overall integrity and consistency of the data.

In the second stage, the four tables are appended. Ideally, this step should have been performed before data profiling to maximize efficiency. However, for the sake of practice, the data profiling was conducted for each table before appending them. After appending the tables, the data is prepared and cleaned. This involves several steps, including adding a sales column by multiplying the quantity ordered and the price, extracting the names of the cities from the purchase address, splitting the date and time from the order date column, extracting the month name from the date column, and finally, removing duplicate rows to ensure data integrity.
The dataset post-column modifications.

In the third stage, the data is ready for analysis and integration into a Power BI report. Each chart corresponds to the predefined business questions, ensuring the report gives clear answers and also facilitating its construction around the key business inquiries. The report consists of four pages, the first page displays all the orders and sales distribution, the second page shows a map with a drill-through for each city and its corresponding sales data, the third page highlights the top and bottom products, sales and orders, while the final page shows specific details about Order IDs within a table format.


FINDINGS
1. What are the top and bottom 5 performing products based on sales?
The top five performing products based on sales are as follows: MacBook Pro laptop, iPhone, Google phone, ThinkPad laptop, and 34-inch ultrawide monitor. Conversely, the bottom five performing products based on sales, ranked from the lowest to the next lowest, are LG dryers, USB-C charger cables, Wired headphones, AA batteries, and AAA batteries. There is a notable contrast between the top-performing products, which are electronics like laptops and smartphones, and the bottom performers primarily consisting of accessories.

3. Can you provide all the details about the products ordered in a given order?
A comprehensive table containing detailed information for each order has been established. This table offers the flexibility to filter data by various criteria such as product, product price, total sales, year, month, date, region, and quantity ordered. This functionality ensures thorough verification of order details while providing a view of all orders processed.

5. What is the distribution of orders by date?
In January, sales typically range between 25 and 35 orders per day, with notable peaks occurring on January 9th, 24th, and 26th, each seeing around 48 orders per day. February shows improved sales performance compared to January, with more frequent peaks exceeding 40 orders per day. March has a slight decline in sales compared to February, with no peaks surpassing 38 orders per day, this trend continues into April. Overall February has the strongest performance for the 4 months.

7. How many orders are received each month?
In January, a total of 970 orders were received, followed by an increase in February with 1078 orders. March maintained order levels with 981 orders while April saw a minor drecrese to 855 orders. Comparing these figures, February stands out as the month with the highest order volume.

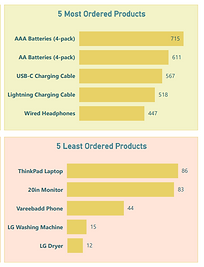
9. What are the five most and least ordered products?
The five most ordered products consist predominantly of accessories such as AAA batteries, AA batteries, USBC Charging cables, lightning charging cables, and wired headphones, indicating a high demand for essential everyday items. On the other hand, the five least ordered products include larger electronics like Thinpad laptop, 20-inch monitor, Vareebad phone, LG washing machine, and LG dryer, suggesting that consumers may be more selective or less inclined to purchase higher-priced electronic devices compared to smaller accessories.
2. How do sales vary across different regions?
The city with the highest sales volume is San Francisco, generating $183k in revenue, in terms of percentage 23.2% of total sales, followed by Los Angeles with $130k in sales. Conversely, the lowest sales are reported in Austin, TX with $37k in sales and 4.7% of total sales. Overall, the total sales across all cities is $789k. Notably, the state of California contributes the most to this figure driven by the sales from San Francisco and Los Angeles.

4. How does the number of orders vary by time of day?
Sales volume fluctuates throughout the day, with peak sales occurring between 7 AM and 12 PM. Conversely, the period from 1 AM to 7 AM sees the lowest number of orders. Understanding these fluctuations in sales patterns can inform strategic decisions regarding staffing, marketing efforts, and inventory management to optimize business performance.

6. How are sales distributed by month?
Sales distribution by month reveals variations in revenue across different periods. March leads with the highest sales volume generating $202k, closely followed by February with $200k in sales. Conversely, January reports the lowest sales, totaling $186k.

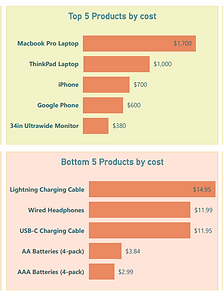
8. Which products rank in the top and bottom 5 based on cost?
The top five most expensive products based on cost are MacBook Pro laptop, ThinkPad laptop, iPhone, Google phone, and 34-inch ultrawide monitor. Conversely, the bottom five less expensive products, ranked from the lowest to the next lowest in terms of cost, are Lightning Charging cables, Wired headphones, USB-C charger cables, AA batteries, and AAA batteries. There is a notable contrast between the top-cost products, which are electronics like laptops and smartphones, and the bottom performers, primarily consisting of accessories.
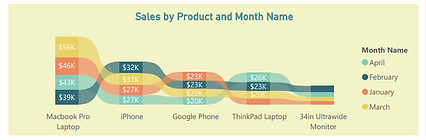
10. How do sales vary by product and month?
The MacBook Pro laptop consistently leads in sales, contributing significantly each month, with March seeing its highest sales at $56k out of a total of $202k. The iPhone follows closely, maintaining consistent sales between $27k and $32k per month, the same happens with the Google phone, and the Thinkpad Laptop maintaining sales for each month in a range of $20k and $23k. These trends emphasize the importance of monitoring product performance to understand revenue dynamics and optimize strategies accordingly.