Walmart Sales with SQL
This project seeks to analyze and explore the Walmart Sales data to gain insights into the top performance of branches and products. It aims to uncover trends in the sales of various product lines and understand customer behavior. The objective is to enhance and optimize sales strategies based on the findings.
The dataset was acquired from Walmart Recruiting - Store Sales Forecasting.
This analysis will be conducted using MySQL to demonstrate my abilities in SQL queries by effectively utilizing them for data analysis, and the results will be presented in a simple/uncomplicated dashboard created in Power BI.
ANALYSIS LIST
1. Product Analysis: To understand the product lines performing the best and identify areas that need improvement.
2. Sales Analysis: To identify the product lines with higher revenue and sales.
3. Customer Analysis: To comprehend different customer behaviors.
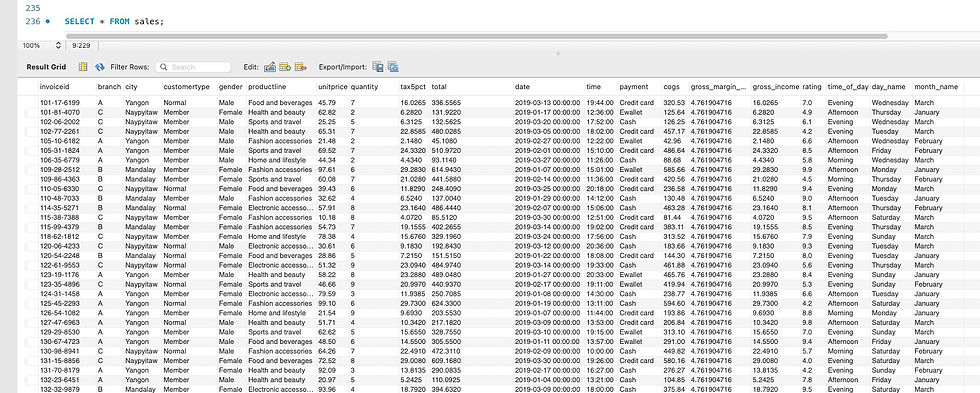
Take a closer look to the dataset:
Generic Questions
1. How many unique cities does the data have?
2. In which city is each branch?
Product Questions
1. How many unique product lines does the data have?
2. What is the most common payment method?
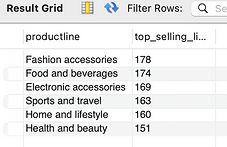
3. What is the most selling product line?
4. What is the total revenue by month?
5. What month had the largest COGS?
6. What product line had the largest revenue?
7. What is the city with the largest revenue?
8. What product line had the largest VAT?
9. Fetch each product line and add a column to those product line showing "Good", "Bad". Good if its greater than average sales.
10. Which branch sold more products than average product sold?
11. What is the most common product line by gender?
12. What is the average rating of each product line?
Sales Questions
1. Number of sales made at each time of the day per weekday.
2. Which of the customer types brings the most revenue?
3. Which city has the largest tax percentage/ VAT (Value Added Tax)?
4. Which customer type pays the most in VAT?
Customer Questions
1. How many unique customer types does the data have?
2. How many unique payment methods does the data have?3. What is the most common customer type?
4. What is the gender of most of the customers?
5. What is the gender distribution per branch?
6. Which time of the day do customers give the most ratings?
7. Which time of the day do customers give the most ratings per branch?
8. Which day of the week has the best average ratings?
9. Which day of the week has the best average ratings per branch?
SQL Solutions: Extracting Insights and Answering Business Questions


Key SQL Statements
What is the most selling product line?
What is the total revenue by month?

What product line had the largest revenue?

What is the city with the largest revenue?

What is the most common product line by gender?

What is the average rating of each product line?

Take a closer look to the graphics:

1) BRANCH A - Yangon
Branch A achieved a total sales volume of 339 products, generating a revenue of 105,861. The standout performer in terms of both sales and revenue is the Home and lifestyle product line. However, it's important to note that while this product line shines within Branch A, it may not hold the same distinction when considering the overall sales and revenue across all branches. The Health and Beauty category experienced the lowest sales and generated the least revenue, marking it as the least successful product line.
2) BRANCH B - Mandalay
Branch B recorded a total sales volume of 329, resulting in a revenue of 104,534. This represents one of the lowest sales volumes and and the lowest revenue among the three branches. The Fashion and Accessories product line stands out due to its higher demand and popularity. It is imperative to maintain a well-stocked inventory for this line. However, the Health and Beauty category contributes as the top revenue-generating product line. Implementing targeted strategies to enhance the performance of the Health and Beauty product line, as well as addressing lines with lower sales and revenue, is crucial for maximizing overall revenue.
3) BRANCH C - Naypyitaw
Branch C achieved a total sales volume of 327, generating a revenue of 110.490. Despite having two fewer sales than Branch B, it has the highest revenue among the three branches, making it the top-performing branch in terms of earnings. The standout performer in terms of both sales and revenue is the Food and Beverages product line. The sports and travel product line has the lowest sales, while the home and lifestyle product line generates the least revenue.
Quantity | Product Line | Revenue | |
|---|---|---|---|
BEST SELLING PRODUCT LINE | 62 | Fashion Accessories | 16.41k |
HIGHEST REVENUE | 53 | Health and Beauty | 19.89k |
WORST SELLING PRODUCT LINE | 50 | Food and Beverages - Home and Lifestyle | 15.21k - 17.55k |
LOWEST REVENUE | 50 | Food and Beverages | 15.21k |
Quantity | Product Line | Revenue | |
|---|---|---|---|
BEST SELLING PRODUCT LINE | 65 | Home and Lifestyle | 22.42k |
HIGHEST REVENUE | 65 | Home and Lifestyle | 22.42k |
WORST SELLING PRODUCT LINE | 46 | Health and Beauty | 12.26k |
LOWEST REVENUE | 46 | Health and beauty | 12.26k |
BRANCH ANALYSIS
Quantity | Product Line | Revenue | |
|---|---|---|---|
BEST SELLING PRODUCT LINE | 66 | Food and Beverages | 23.77k |
HIGHEST REVENUE | 66 | Food and Beverages | 23.77k |
WORST SELLING PRODUCT LINE | 44 | Sports and Travel | 15.68k |
LOWEST REVENUE | 45 | Home and Lifestyle | 13.90k |

General Strategies
1. Inventory Management:
Maintain a well-stocked inventory for high-demand products, especially in the Fashion and Accessories and Food and Beverages. These product lines are the most in-demand across all three branches combined. Also, adjust inventory levels for Health and Beauty products to prevent overstocking.
2. Marketing and Promotion:
Implement targeted marketing strategies for the Food and Beverages and Fashion and Accessories product lines, considering their popularity and high ratings. Also, design promotions or discounts to boost sales in lower-performing categories, such as Health and Beauty.
The three branches experienced their highest combined revenue in January, making it the best month for sales across the board. Explore additional strategies that contributed to this success during January and consider implementing them in future months.
3. Customer Segmentation:
Adapt marketing efforts based on customer demographics. Focus on male customers for Health and Beauty products and female customers for Food and Beverages and Fashion Accessories.